

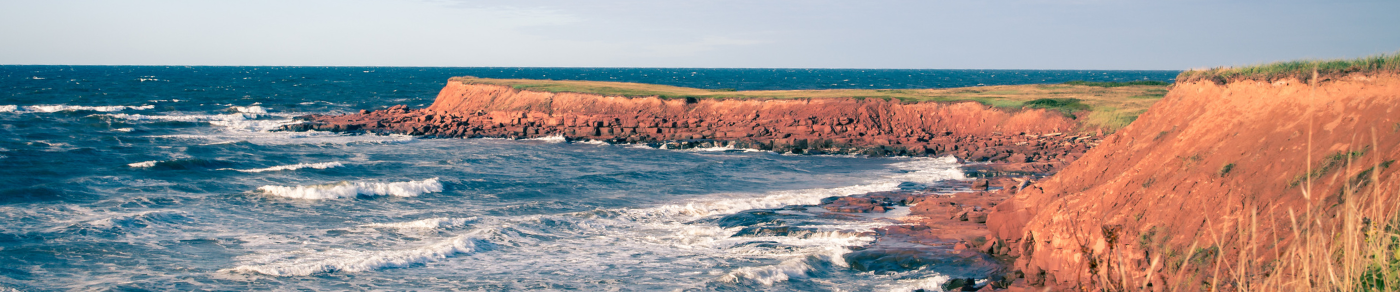
Discovering the Seafloor of the Bay of Fundy

The Bay of Fundy is home to rich fisheries and significant tidal power potential. Developments are underway to utilize this renewable tidal energy source, but a better understanding of the bay's underwater geography is needed to identify safe and suitable turbine locations. The Geological Survey of Canada (Atlantic) of Natural Resources Canada has responded to this need by mapping the Bay of Fundy seabed, and by providing topographic and geological maps and knowledge. This information will help guide tidal power generation decisions and aid efforts to manage the bay's biological resources.
Mapping the bottom of the bay
GSC researchers collaborated with the Canadian Hydrographic Service (Fisheries and Oceans Canada), the Ocean Mapping Group of the University of New Brunswick, and the Centre of Geographic Sciences of the Nova Scotia Community College to map the topography and geology of the ocean bottom and the character and thickness of seabed sediments. This was achieved using a suite of sophisticated survey tools and techniques, including shipboard and aircraft-based devices.
Multibeam sonar (SOund Navigation And Ranging) is a device mounted under a survey vessel that rapidly sends out beams of high frequency sound signals or "pings". The sonar listens for the echoes of the pings from the seabed and then calculates the water depth based on the time taken for the echoes to return (this type of surveying is known as multibeam bathymetry). The GSC and its partners collected millions of these depth determinations and used them to construct an accurate relief map of the Bay of Fundy seabed. The resulting map is similar to how an aerial photograph would show the Bay of Fundy with all of its water removed (Figure 1).
Until recently, shallow areas adjacent to the coast (the intertidal zone) had not been bathymetrically surveyed due to the danger of operating a vessel there. To overcome this challenge, researchers used an aircraft-mounted device known as LiDAR (Light Detection And Ranging). During low tide, the aircraft flew along the Bay of Fundy coast while the LiDAR emitted pulses of laser light. Similar to the sonar technique, the light pulses were reflected from the land and recorded by the aircraft's device. Millions of these measurements provided an accurate map of the intertidal zone. The combination of the multibeam sonar and LiDAR results provided the first detailed and "seamless" map from the bottom of the Bay of Fundy across the shoreline and onto land (Figure 2).

Once the ocean bottom topography was mapped, seismic profiling techniques were used to determine the types of rock and sediment that lay beneath the seafloor. Sound energy was used once more, this time to produce echoes from layers of sediment up to 50 m beneath the seabed. The result was a series of sub-surface profiles of sediment thickness produced as the survey ship completed transects of the bay (Figure 3).

Key Findings
- The Bay of Fundy's seafloor is covered with glacial landforms created by a continental ice sheet that once covered the entire area and retreated about 14,000 years ago. The glaciers created complex and highly variable seafloor geology within the bay.
- Fields of sand waves, up to 20 m high, move and change with each tidal cycle (Figure 4). How much and how often the bedforms move is important for designing and locating future tidal energy installations.

Please contact Brian Todd (GSC), for further information about the science underlying the Bay of Fundy maps, or the ongoing geological investigations in the bay by the Geological Survey of Canada.